Analytics and Reporting

Measure. Improve. Market growth.

Discover how well campaigns work by using data-driven analysis to monitor user behavior, engagement, and conversions across your platform. We instrument your stack, unify your data, and turn it into dashboards your team actually uses.

The stack

Analytics tools we can implement for you

GA4 and Google Tag Manager

Track key user interactions and conversions across your website and app; measure performance and user behavior.

Measurement

Segment → BigQuery

Collect, unify, and send customer data to all your tools; ensuring consistent insights across your campaigns.

Data pipeline

Looker / Tableau

Analyze KPIs, feature usage, user flows, and retention so you can optimize for engagement and business growth.

Visualization
How we work

From raw events to decisions

  • Audit: we map what you're tracking today, what's broken, and what's missing against your GTM goals.
  • Instrument: GA4/GTM setup, custom events tracking, and CDP wiring done right the first time.
  • Visualize: custom dashboards for the KPIs each team cares about, from campaign ROI to retention.
  • Optimize: a reporting cadence that feeds learnings back into your campaigns and platform.
Get your analytics audit →
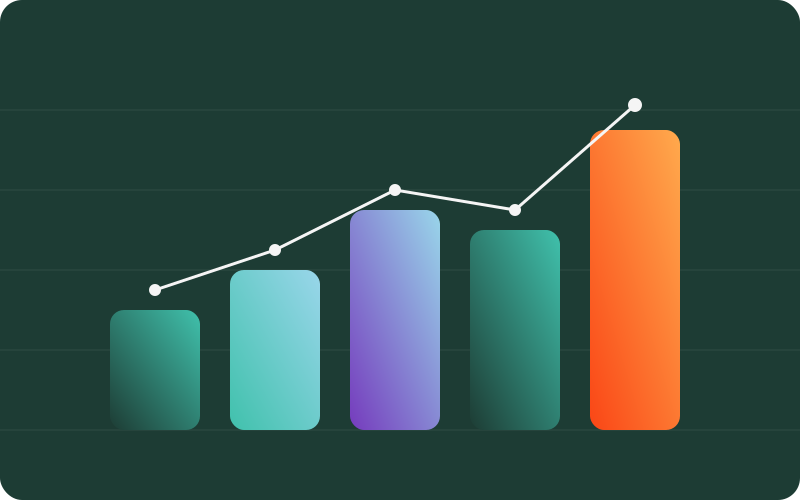
Block bar chart with rising trend line - MarketGrowth analytics visual

One system: measurement, pipeline, and visualization working together.

Deliverables

What you get

01

Tracking plan

A documented event taxonomy your whole team can rely on.

02

Custom dashboards

Purpose-built views in Looker, Tableau, or GA4 for each stakeholder.

03

Custom events tracking

The conversions and micro-interactions that actually matter to revenue.

04

Reporting cadence

Weekly or monthly reporting rituals with insights, not just numbers.

Stop guessing. Start measuring.

Tell us about your stack and goals, and we'll show you what a clean measurement setup looks like for your business.

Book a free consult →